The crisp and refreshing taste of an ice cold brew is unlike any other beverage on the menu. What are some ways to represent a beer and it’s attributes with statistics and math? This is the burning question everyone wants to know while sipping the nectar of the gods. Okay, so maybe it’s not, but let’s do it anyways!
The self-proclaimed “go-to resource for beer”, a website known as Beer Advocates, contains all your resources for beer descriptions and discussions. Even you can take part in the brawl of the brews. Beer Advocates is the home for millions of ratings and reviews on any beer you could possibly imagine.
I took just a small sample of that data to conduct two statistical tests in order to answer these so-called “burning questions”. The dynamism of data that can be squeezed out of a handful of wheat-fueled evaluations is quite interesting. In all seriousness, however, I truly wonder if the trends of the beer world are actually true. I wouldn’t consider myself a follower, but I’m always taking recommendations for new beers. My question, however, is can the results of an online compilation of beer reviews give you trustworthy insight on a possible addition to your fermented arsenal?
The Bitter Results
To figure this out, I gathered a dataset from Beer Advocates containing just shy of 1.6 million unique reviews on miscellaneous beers from around 5,000 different breweries and immediately ‘hopped’ into my work. Before delving into this discussion, I wanted to first figure out the winner of the popularity contest. Personally, if there was any way I would let these reviews influence my buying decisions, there would have to be an absence of IPA’s in the list of beers with the highest review counts. Not surprisingly however, I was grasping at straws for that one. After curating this list, the graph below shows the results.
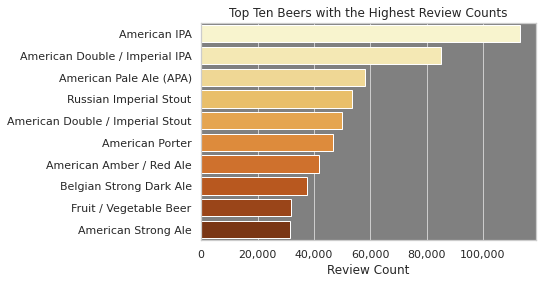
Finding the most revered style of beer seemed like the logical place to start. As a result of filtering through all of the data, the classic IPA brought a shout out. The graph shows the top 10 beer styles that had the highest review count from this dataset. Out of these elite chart-busters, it’s clear that IPA’s claim top trumps; the American IPA and the American Double IPA accounting for a whopping 13.1% of all reviews from this dataset. Now like I said, that news is probably not new to any of us but is begging for further evaluation. India Pale Ale’s are definitely not my cup of beer but, according to my conclusions thus far, I may be missing out.
A TASTY SURPRISE
To start off testing my hypotheses, I wanted to see if there was some sort of correlation between each review’s statistics (using a two-sample t-test) on these piney pints. The review process for Beer Advocates allows for a half or full star rating from 1 to 5 stars for the chosen beer. I conducted this test to see if each person’s overall score was usually the same as how they rated the beer’s taste. By analyzing reviews on only American IPA’s, I could try to determine if the taste scores were different in respect to the overall rating of the beer itself. This was the first chance to earn my trust.

Many of the breweries from the dataset had multiple reviews of the same beer. I chose only the breweries with over 1,000 reviews on their American IPA to make sure there would be enough observations to retrieve a solid average. I assumed that, in general, the average overall score for each beer would be about the same as the average score given for it’s taste. However, compared to earlier, my results were shocking this time. I found that no statistically significant correlation existed between the two categories. I guess these people might be trustworthy after all. If they can agree that the taste is great but overall feel like the rating is low, there may at least be a chance that I can add a new brew to my repertoire.
REVIEWING UNDER THE INFLUENCE?
Taste ratings have been clearly influential in deciding whether or not to trust inebriated and opinionated individuals. However, alcohol content is another heavily debated aspect of beer culture. For this second test (now a one-sample t-test), does calculation live up to expectation? Each beer in this dataset contains a respective abv percentage (alcohol by volume, if you don’t already know). If we look at Live Science, we are told that an average 12oz beer has an abv of 4.5%.
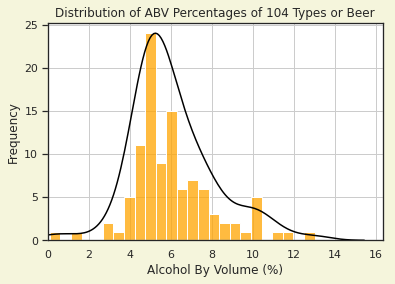
I took a list of 104 different styles of beer from the data to calculate an average abv content across the full range of recipes. The graph above shows the distribution of the alcohol content for each kind of beer. It’s clear to see that most of the beers have an abv percentage of around 5%. This would closely line up with the original hypothesis. However, when we take into consideration all the beers with an abv higher than 5%, our mean (or average) abv is pulled further to the right. In calculation, the true mean is found to be between 6.04% and 6.06%.
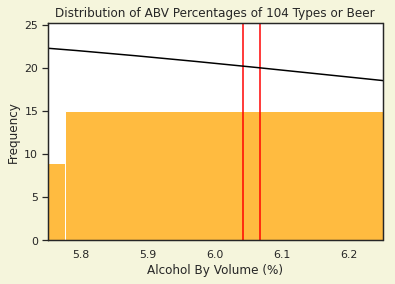
The second figure is a portion of the graph above that has been magnified to see the range (the space between the red lines) where most of the average abv contents will fall. After a given estimate of 4.5%, it seems like our reviewers generally focus on higher percentage beers to be the victims of their scrutiny. Although it may seem like 5% beers are more common, most people seem to have more to ‘buzz’ about with beers of an elevated abv.
CHECK PLEASE
In conclusion, let’s just remind ourselves that when a beer is put in your hand, just drink it. However, the next time that one of these cool, crisp beverages slides down your throat, maybe you can have a little more insight as to how the trends of the beer world hold up. IPA’s seem to top the charts and alcohol-inspired analyses may not get you what you want. So can you really trust what other people say? Or do you just have to start a tab and find out on your own?
Check out the code here.